AFK Epidemiology

Feb 5 / AFK study plan
- Studying epidemiology as a dentist may seem challenging, but it’s a trendy topic for the AFK (Assessment of fundamental knowledge) exam!

- Today, let’s tackle just 5 questions from our question bank together, diving into each answer and the concepts behind them.

-If you’re pressed for time, feel free to scroll to the end of the page to find the ✅ Takeaway & 📌 Study Tip. Together, let’s empower ourselves with knowledge!

#Epidemiology 
1-A study in which researchers enrolled 52,877 women in 1990 and collected exposure and lifestyle information to assess the relationship between these factors and subsequent occurrence of cancer, is an example of which type of study? 
◯ A. Cross Sectional.
◯B. Prospective Cohort. 
◯ C. Retrospective Cohort.
◯ D. Case-Control.
◯ E. Randomized Controlled Trial.

 B. Prospective Cohort. 

Explanation:

A prospective cohort study is a type of observational study in which a group of individuals (a cohort) is followed over time to observe how specific exposures or lifestyle factors affect outcomes, such as the development of a disease.
In this case:

Researchers enrolled 52,877 women in 1990.

They collected exposure and lifestyle information at the beginning.

They then followed the women over time to see if they developed cancer.

This study:

This fits the definition of a prospective cohort study because:
✅ The study started before the participants developed the disease.
✅ It tracked exposures (lifestyle factors) over time before the outcome (cancer) occurred.
✅ It aimed to determine how those factors influenced the future occurrence of cancer.

#Epidemiology 
2-A 0.05 P value indicates
◯ A There is a 95% probability that the null hypothesis is correct.
◯ B. There is a 95% probability that the null hypothesis is incorrect.
◯ C. There is a 95% probability that the alternative hypothesis is correct.
◯ D. There is a 95% probability that the alternative hypothesis is incorrect.

 C. There is a 95% probability that the alternative hypothesis is correct.
A p-value of 0.05 means that, assuming the null hypothesis is true, there is a 5% probability of obtaining a result as extreme or more extreme than the observed data due to random chance alone.

Explanation of P-Value (0.05):

A p-value is the probability of observing data as extreme or more extreme than the observed results, given that the null hypothesis (H₀) is true.
A p-value of 0.05 means that if the null hypothesis is correct, there is a 5% chance that the observed data (or more extreme data) could occur just by random variation.

Proper Interpretation of a P-value of 0.05:

If the p-value is less than or equal to 0.05, we typically reject the null hypothesis, suggesting that the observed effect is statistically significant.
However, a p-value does not confirm the correctness of any hypothesis—it only measures how likely the data would be if the null hypothesis were true.

Testing a new toothpaste

The null hypothesis (H₀):
The new toothpaste does not reduce cavities better than regular toothpaste (no difference).
The alternative hypothesis (H₁):
The new toothpaste does reduce cavities better than regular toothpaste.
Now, what does the P-value mean?
The p-value tells you how likely it is that you got your study results just by random chance if the new toothpaste actually has no real effect (null hypothesis is true).
✅ If P < 0.05 (e.g., 0.01 or 0.001) →

The chance of the result being due to luck is even smaller, making you more confident that the new toothpaste really does work.
❌ If P > 0.05 (e.g., 0.10) →
The result is not statistically significant, meaning the difference might just be random, and there's not enough proof that the new toothpaste is better.

#Epidemiology 
3- Test Sensitivity is defined as? 
◯A. Is the ability of the test to correctly identify those without the disease.
◯ B. Is the ability of a test to correctly identify those with the disease.
◯ C. Is the ability of a test to correctly identify those with and without the disease.

 B. Is the ability of a test to correctly identify those with the disease.
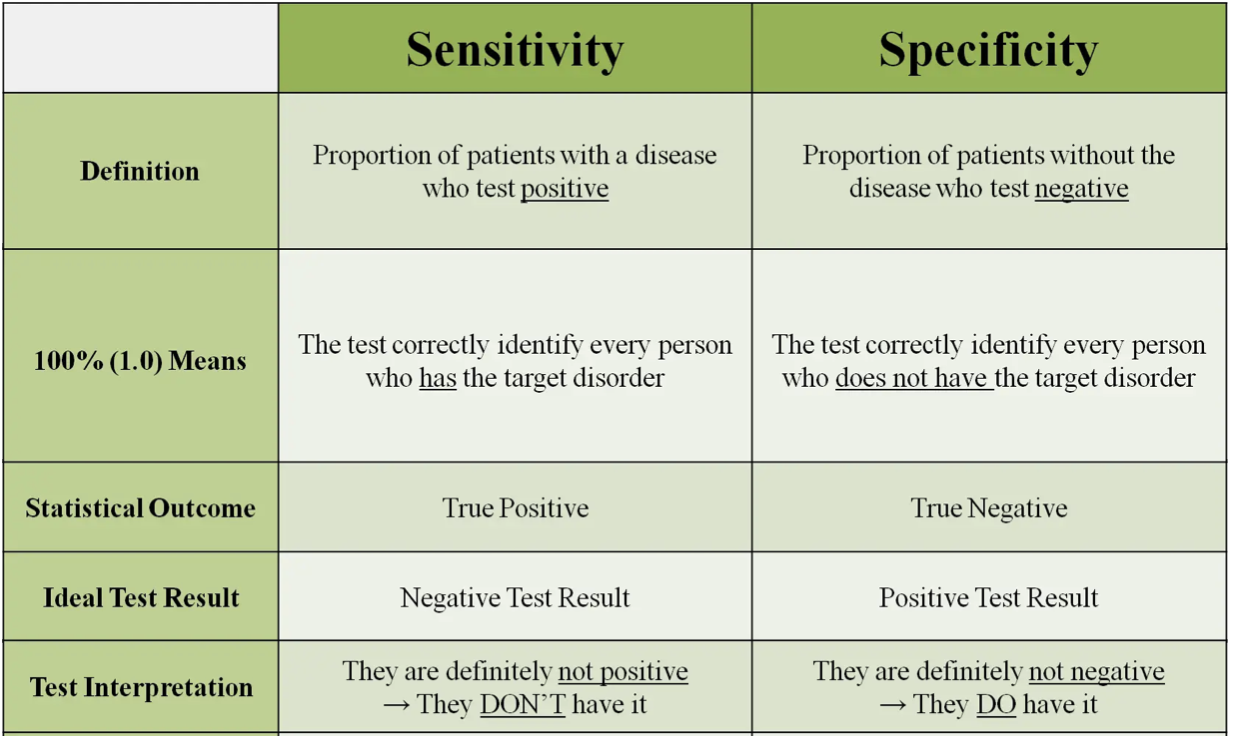
Sensitivity measures how well a test detects disease in those who truly have it. It tells us the percentage of people with the disease who actually test positive.

Formula for Sensitivity:

Sensitivity= True Positives (TP) / True Positives (TP) + False Negatives (FN) 
True Positives (TP) → People who have the disease and test positive.
False Negatives (FN) → People who have the disease but test negative (missed cases).

Why Sensitivity is Important?

- A high sensitivity means the test is good at detecting the disease and has fewer false negatives.
- It is especially important for serious diseases (e.g., oral cancer screening) where missing a diagnosis can be dangerous.
- If a test has 100% sensitivity, it means everyone who has the disease tests positive (no false negatives).
Example of Sensitivity and Specificity in Detecting Periodontal Disease 🦷
You screen 1,000 patients using a new periodontal disease test, and you compare the results with the gold standard (confirmed diagnosis by a periodontist).
Actual Diagnosis of Patients (Gold Standard)
- 600 patients truly have periodontal disease
- 400 patients do not have periodontal disease
Test Results from the New Diagnostic Test
- 500 tested positive (out of which 450 truly had periodontal disease, and 50 were false positives)
- 500 tested negative (out of which 150 actually had the disease but were missed, and 350 were truly healthy)

Sensitivity (Ability to Detect Disease)

Sensitivity measures how well the test identifies patients with periodontal disease (true positives).
✅ Interpretation: The test correctly detects 75% of people with periodontal disease.
❌ Misses 25% of diseased patients (False Negatives).

Specificity (Ability to Identify Healthy People)

Specificity measures how well the test identifies people who do NOT have periodontal disease (true negatives).
✅ Interpretation: The test correctly identifies 87.5% of healthy patients as disease-free.
❌ Falsely diagnoses 12.5% of healthy patients as diseased (False Positives).

How This Affects Clinical Practice?

If a test has high sensitivity →
Use it to screen patients (e.g., periodontal probing, saliva tests).
If a test has high specificity →
Use it to confirm diagnosis (e.g., X-rays, biopsy in oral cancer cases).
If the test has low sensitivity →
It may miss patients who actually have the disease (dangerous for progressive conditions like periodontitis).
If the test has low specificity →
It may unnecessarily alarm and treat healthy patients (leading to overtreatment).

✅ Sensitivity (75%) → How well the test detects periodontal disease.
✅ Specificity (87.5%) → How well the test identifies healthy patients.

🔹 A highly sensitive test is useful for initial screening (e.g., periodontal probing).
🔹 A highly specific test is important to confirm a diagnosis (e.g., advanced radiographs).

Would you rather miss a real case or falsely diagnose a healthy person?
Understanding sensitivity and specificity helps you choose the right test for the right purpose! 🦷😊

#Epidemiology 
4- When the odds ratio is 0.3 and the 95% CI is (0.15-0.45) this indicates? 
◯ A. There is strong evidence that the risk will lead to the event.
◯B. There is weak evidence that the risk will lead to the event.
◯ C. There is strong evidence that the risk will not lead to the event.
◯ D. There is a weak evidence that the risk will not lead to the event.

 C. There is strong evidence that the risk will not lead to the event.

The Odds Ratio (OR) is a measure of association between an exposure (risk factor) and an outcome (disease/event).

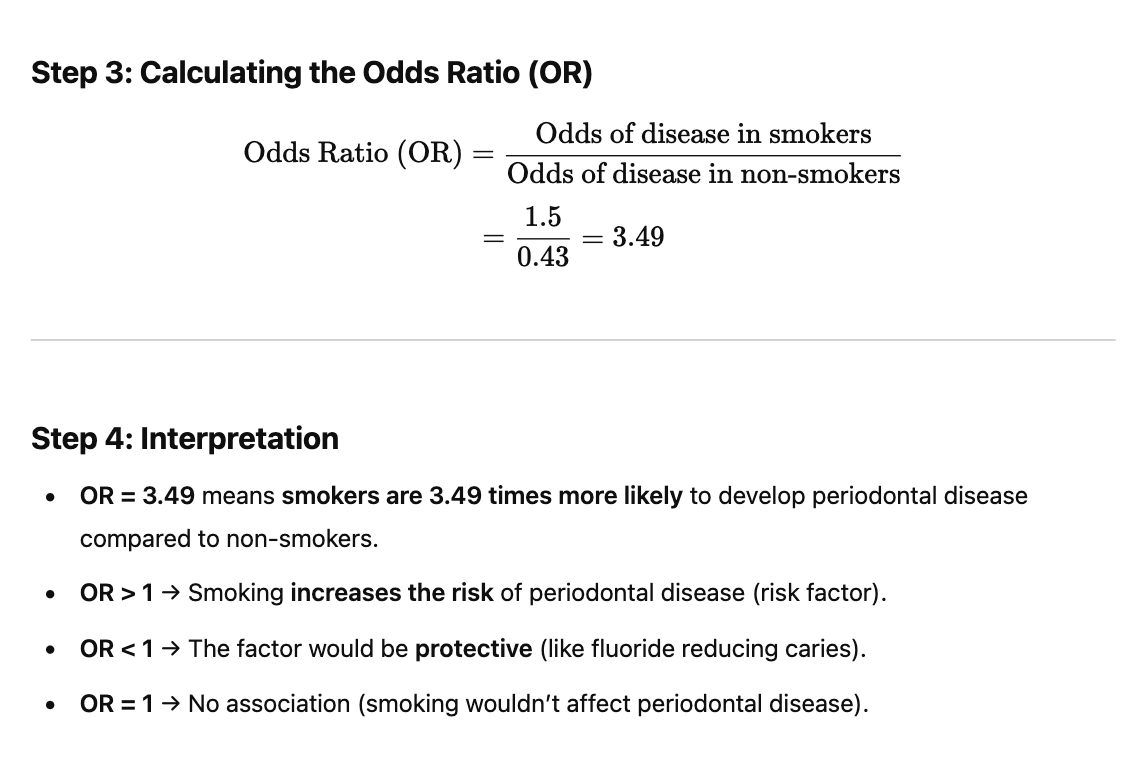
If OR > 1 → The risk factor is associated with a higher likelihood of the event occurring.
If OR = 1 → There is no association between the risk factor and the event.
If OR < 1 → The risk factor is associated with a lower likelihood of the event occurring (protective effect).

Understanding the Given OR and Confidence Interval

OR = 0.3 → This means the exposure reduces the odds of the event occurring by 70% (1 - 0.3 = 0.7 or 70%).
95% Confidence Interval (CI) = (0.15 - 0.45) → This means we are 95% confident that the true odds ratio lies between 0.15 and 0.45.
Because the entire confidence interval is below 1, this suggests a strong protective effect, meaning the risk factor significantly reduces the event occurrence.

✅ (c) There is strong evidence that the risk will not lead to the event.

Since OR < 1 and the CI does not cross 1, this strongly suggests that the exposure decreases the likelihood of the event happening.
The narrow CI (0.15 - 0.45) shows that the estimate is precise, providing strong evidence that the risk factor is protective against the event.

Final Conclusion
✔ Odds Ratio (0.3) suggests a strong protective effect.
✔ The entire confidence interval (0.15-0.45) is below 1, meaning the risk is significantly lower.
✔ There is strong evidence that the exposure reduces the event occurrence.

👉 Final Answer: (c) There is strong evidence that the risk will not lead to the event.

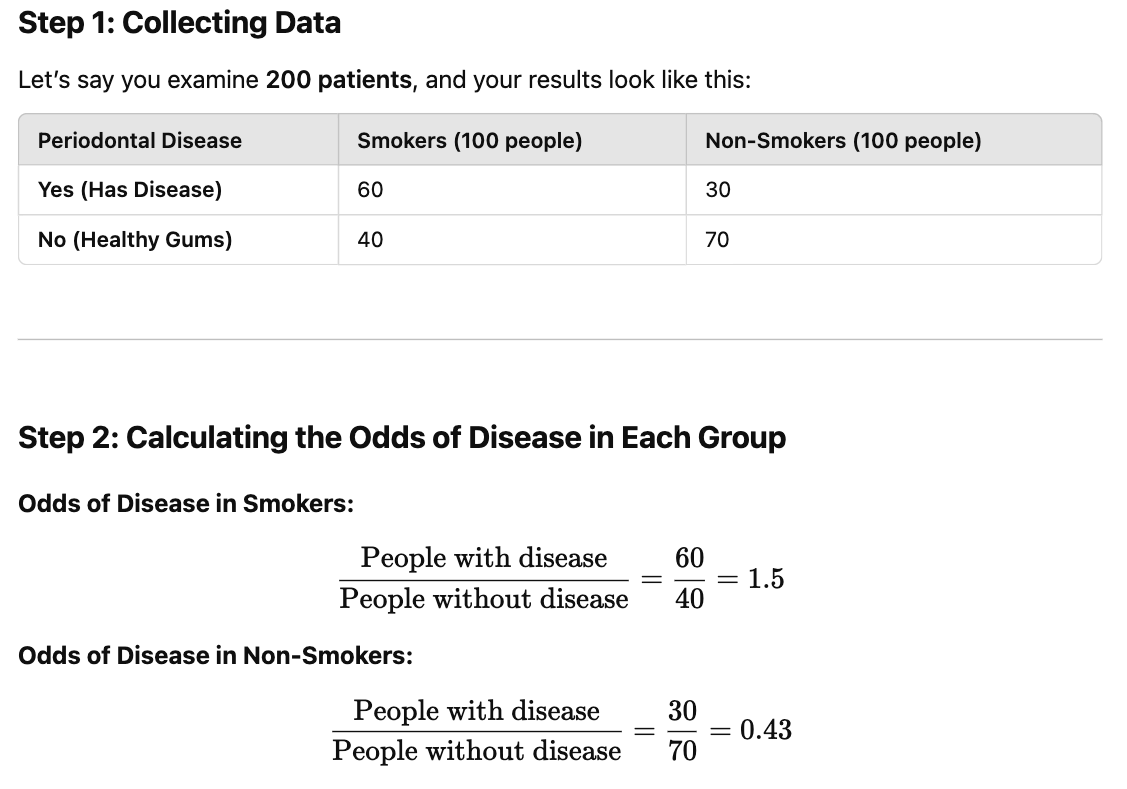
Odds Ratio (OR) Explained with a dental example 🦷
Imagine you want to study whether smoking increases the risk of periodontal disease.
You conduct a study with two groups:
Smokers 🏭
Non-smokers 🚫
How This Helps You as a Dentist?
If a patient smokes, you can warn them that they are over 3 times more likely to develop periodontal disease.
If the OR was less than 1, that would suggest something protects against periodontal disease
(e.g., fluoride use, regular flossing).
Higher OR=
Stronger association, meaning it’s a serious risk factor in oral health.

#Epidemiology
5-A newly developed device designed for measuring oro-facial pain is under evaluation. The device provides consistent readings among the subjects, however, there is a lack of correlation between the device's readings and the subjects' self-reported pain index. Based on this information, which of the following best describes the performance of the device?
◯A. Low sensitivity and high specificity.
◯ B. High sensitivity and low specificity.
◯ C. High reliability and low validity.
◯ D. Low reliability and high validity.

 C. High reliability and low validity.

Understanding Reliability vs. Validity
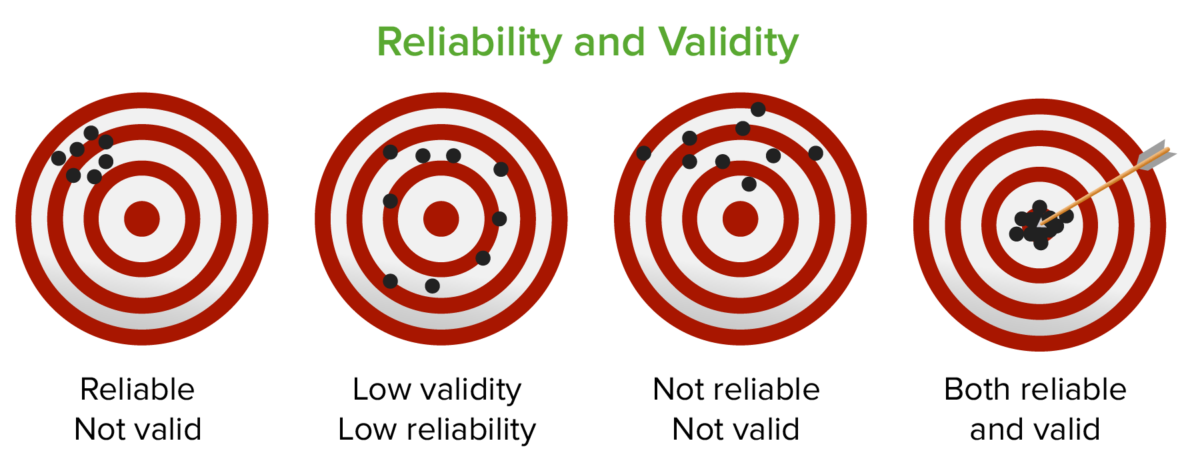
Reliability:

Refers to consistency—whether a test or device gives the same results when used multiple times on the same subject.

Validity:

Refers to accuracy—whether the test actually measures what it is supposed to measure.
The new device provides consistent readings among subjects → This indicates HIGH RELIABILITY because it consistently gives the same measurements.
However, the device’s readings do not correlate with self-reported pain scores → This indicates LOW VALIDITY, meaning the device does not accurately measure oro-facial pain.
Since the device is consistent but inaccurate, it has high reliability but low validity.

✅ Takeaway & 📌 Study Tip

1️⃣ Study Type: Prospective Cohort Study

✅ Takeaway:
A prospective cohort study follows a group of people over time to observe how exposures (e.g., lifestyle factors) influence outcomes (e.g., cancer).
📌 Study Tip:
Prospective = Forward-looking (follow people into the future).
Retrospective = Looking back at past data.
Cross-sectional = Snapshot in time.
Case-control = Start with disease, look for past exposure.

2️⃣ P-Value Interpretation

✅ Takeaway:
A p-value of 0.05 means there is a 5% chance that the observed results happened by random chance if the null hypothesis is true. It does not measure the probability of the hypothesis being true or false.
📌 Study Tip:
Low p-value (<0.05) → Statistically significant (reject null hypothesis).
High p-value (>0.05) → Not significant (fail to reject null).
P-value ≠ Proof! It only suggests whether results are likely due to chance.

3️⃣ Sensitivity vs. Specificity (Periodontal Disease Example)

✅ Takeaway:
Sensitivity = How well a test detects disease (True Positives).
Specificity = How well a test rules out disease (True Negatives).
High sensitivity → Fewer false negatives (good for screening).
High specificity → Fewer false positives (good for confirming diagnosis).
📌 Study Tip:
Memory Trick: "SNOUT" = Sensitivity rules OUT disease (good for screening).
"SPIN" = SPecificity rules IN disease (good for confirmation).
Example: A periodontal probe should have high sensitivity to catch most cases of disease.

4️⃣ Odds Ratio (OR) Interpretation

✅ Takeaway:
OR > 1 → Risk factor increases the odds of disease.
OR < 1 → Risk factor reduces the odds of disease (protective effect).
OR = 1 → No association.
If the entire Confidence Interval (CI) is below 1, the protective effect is statistically strong.
📌 Study Tip:
Odds Ratio ≠ Risk Ratio (OR compares odds, not absolute risk).
Look at the CI → If it includes 1, the result is not statistically significant.
Example: Smoking OR = 3.49 for periodontal disease → Smokers are 3.49 times more likely to develop the disease.

5️⃣ Reliability vs. Validity (Oro-Facial Pain Device Example)

✅ Takeaway:
Reliability = Consistency (Does it give the same result each time?).
Validity = Accuracy (Does it measure what it’s supposed to?).
A test can be reliable but not valid (e.g., consistently wrong).
📌 Study Tip:
Memory Trick: "Reliable but not valid = Broken clock problem" (A broken clock shows the same time every day—consistent but wrong!).
High validity requires high reliability, but high reliability does not guarantee high validity!

Join our AFK Weekly newsletter

 Solving questions is really important, but solving exam grade questions with true and authenticated answers is critical.
Will post a question everyday, then at the week end will do a video to explain the correct answers and the concept of each questions, signup now to get weekly updates.
Thank you!